ClimateFast 2013
Dear friends,
We are very energized by the response to ClimateFast this year. Because of the letters you have sent we are getting a strong and positive response from many more MPs. Support for the three asks - end fossil fuel subsidies, put a price on carbon , and develop a renewable energy plan for Canada - is growing. Please continue to spread news of this letter writing initiative to your friends and family members. Thank you!
Over the last few days we have acquired pledges from several more NDP and Liberal MPs. We have not posted all of them because we are waiting for confirmation from the MPs who signed online (we do not want any spammers.) Check climatefast.ca/pledges over the next few days to see the names of the MPs, organizations and individuals who have pledged their support of our three asks.
Today we are taking a couple of hours from the Hill to attend a panel discussion on fossil fuel subsidies.
We added even more photos to the website today.
Upcoming Events
The Candlelight Vigil at the Eternal Flame, Parliament Hill will start at 7pm on Wednesday. If you are in Ottawa, please join us.
The program will include the following speakers and entertainers.
Anishnawbeg Spirit Keeper Barbara Hill and singer Judith Fransom
Rev. Frances Deverell, Canadian Unitarians For Social Justice and Ottawa Host, ClimateFast
The ClimateFasters: Rita Bijons, Amelia Rose Khan, Betty Muir, Nadine Hawkins, Patricia Warwick, Margaret Rao, Frances Deverell
Just Voices – Song For The Climate
Vela - Tar Free 613
Chris White – Song Leader
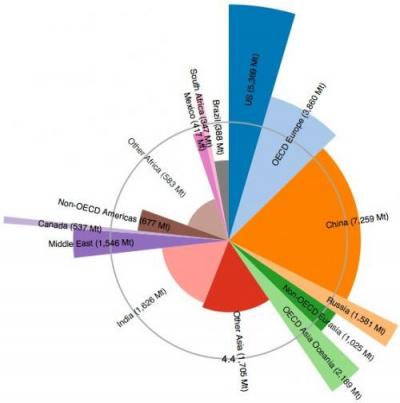
The chart represents IEA Emissions by country. The wedges in this chart represent the percapita emissions (radius), population (andle) and total emissions (area). The emphasis should be on percapita since it is not fair to compare countries with large populations to those with smaller populations. The obligation should be on countries such as Canada to reduce our percapita emissions. The grey circle represents the average global percapita emissions. The chart is based on IEA figures from 2010 (the most recent.) NOTE: Canada is the mauve wedge sticking out between the Middle East and Non-OECD Americas. The numbers on each wedge are the total emissions for that country. Canada's were 575 Mega tonnes in 2010.
Patricia, on behalf of
Hungry for Climate Leadership
|
|

Climate Fast participants are volunteers; your donation will be used for expenses such as flyers, room rental and transportation. Your support is very much appreciated!
If you would like to donate by cheque, make it payable to:
Ontario Voice of Women for Peace, (with Climate Fast in the memo line)
Mail it to:
7 Labatt Avenue, Suite 201 Ci
Toronto, Ontario, M5A 1Z1


|