In July 2012 Environment Canada published a report with 2 sets of trends that includes a credit of 25 Mt of CO2e for Land Use, Land Use Change and Forestry (LULUCF). The published trends only include the LULUCF credit for the years 2015 and 2020. In order to be consistent we applied the LULUCF credit to all emissions and targets.
In addition, this chart includes what our emissions ought to be if Canada followed the recommendations in the 2014 IPCC reports ... 25-40% reduction of 1990 levels by the year 2020 as well as a horizontal green line which represents the target of 350 PPM.
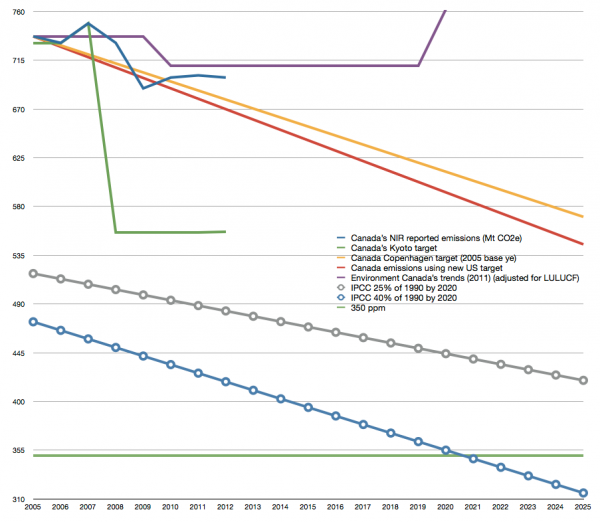
Measurement units
Emissions can be reported in different units. Frequently equivalent carbon dioxide (CO2e) is used, whereas others use carbon dioxide (CO2). CO2e is used in these measurements.
Actual reported emissions (blue)
Canada's actual emissions are reported annually by Environment Canada through National Inventory Reports. The most recent report was published for the period ending 2010 and Canada emitted 692 Mt CO2e.
Canada's Kyoto target (green)
In 1997 the Jean Chrétien government signed the Kyoto Protocol. It was ratified in 2002. Each country set their own target and Canada's Kyoto target was a 6% total reduction by 2012 compared to 1990 levels. In 1990 our emissions were 592 Mt CO2e therefore our Kyoto target was 557 Mt CO2e.
Canada's Copenhagen target (yellow)
The first Harper target was 20% below 2006 levels by 2020 (this was 577 Mt CO2e). The next Harper target was 17% below 2005 levels by 2020. Due to the fact that emissions were higher in 2005 this allowed a higher target of 607 Mt CO2e.
Canada's Copenhagen target - adjusted to match new US target (purple)
In November 2014 the USA announced that they were adjusting their target to be 26-28% below 2005 levels by 2025. This is actually 4% less ambitious than their Copenhagen target of 17% by 2020.
Environment Canada's 2011 trends (adjusted to include LULUCF)
An Environment Canada report on Emission Trends published in 2011 makes two predictions: one assumes business as usual and the other assumes the continuance of existing government measures.
The complete 2011 report can be read here
In July 2012 Environment Canada published a revised set of trends which include a credit of 25 Mt of CO2e for Land Use, Land Use Change and Forestry (LULUCF). In their trends they only include the LULUCF credit for the years 2015 and 2020. The chart above applies the LULUCF credit to all emissions and targets in order to be consistent.
Here are the numbers in the 2012 report
| 2005 | 2010 | 2015 | 2020 | |
|---|---|---|---|---|
| Emissions – Assuming No Government Measures | 740 | 718 | 784 | 850 |
| Emissions – with Existing Government measures* | 740 | 692 | 700 | 720 |
| Difference – Impact of Existing Government Measures** | 0 | -26 | -84 | -130 |
* Includes the contribution of LULUCF in 2015 and 2020 - estimated to be 25Mt CO2e.
** The report did not include the Difference row. I calculated it for this site.
The complete 2012 report can be downloaded here
Conclusion
On the subject of meeting our climate targets, this NRTEE paper(PDF) is the most recent. It concludes that:
"Canada will not achieve its 2020 GHG emission reductions target unless significant new, additional measures are taken. More will have to be done. No other conclusion is possible."
Credit: Climate Action Now